How to Automate Software Deployment Verification with AI
How to Automate Software Deployment Verification with AI
Every engineering team I've talked to in the last year has the same dirty secret: they've built this beautiful CI/CD pipeline—GitHub Actions, ArgoCD, Kubernetes, the works—and then at the end of it, someone sits there for 45 minutes manually checking dashboards, scrolling through logs, and squinting at metrics before giving the thumbs up that the deploy is actually healthy.
That's insane.
You've automated the build. You've automated the deploy. But the verification—the part where you confirm the thing you just shipped actually works—is still some engineer's afternoon.
Let's fix that.
What the Manual Workflow Actually Looks Like
Here's the typical post-deployment verification flow I see at most mid-to-large engineering orgs. Even the ones that think they're automated:
Step 1: Deployment completes (automated, 5–15 minutes) Your pipeline pushes the new version. Kubernetes rolls it out. Green checkmarks in ArgoCD. Great.
Step 2: Smoke tests run (semi-automated, 5–10 minutes) A suite of end-to-end tests hits critical paths. Login, core API endpoints, maybe a purchase flow. These are automated, but someone has to look at the results because 40–70% of test failures in most organizations are flaky. So an engineer opens the test report, triages which failures are real and which are noise.
Step 3: Metrics check (manual, 15–30 minutes) Someone opens Datadog or Grafana. They're eyeballing error rates, latency percentiles (p50, p95, p99), CPU and memory utilization, and request throughput. They're comparing these numbers to "what feels normal." Maybe they have a mental baseline. Maybe they check last Tuesday's deploy for comparison. This is vibes-based engineering.
Step 4: Log review (manual, 10–20 minutes) Someone queries Splunk or Elasticsearch for new error patterns. They're grepping for stack traces, new exception types, anything they haven't seen before. They're also trying to filter out the 47 known errors that nobody has fixed yet.
Step 5: Business metric validation (manual, 10–30 minutes) For customer-facing deploys, someone checks conversion rates, checkout completion, API response times that affect revenue. This often involves pulling up a second dashboard or even a spreadsheet.
Step 6: Canary analysis (semi-manual, 15–45 minutes) If you're running canary deployments, someone is comparing the canary cohort against the baseline. Are error rates higher? Is latency worse? By how much? Is it statistically significant or just noise? Most teams don't do proper statistical analysis here. They eyeball it.
Step 7: Go/no-go decision (manual, 5–15 minutes) An engineer, a lead, or sometimes a manager makes the call. Ship it fully? Roll back? Wait and watch?
Total human time per deployment: 30 minutes to 2+ hours.
For a team deploying multiple times per day, that's one to several engineer-hours daily just watching dashboards. For enterprises doing weekly releases, it can stretch to 4–5 hours when you add approval gates and compliance sign-offs.
Why This Hurts More Than You Think
The time cost is obvious, but there are worse problems hiding underneath.
Inconsistency. Engineer A and Engineer B have different thresholds for "that latency spike looks concerning." One rolls back on a 15ms p99 increase. The other ignores a 50ms jump because they've seen worse. There's no codified standard for what "healthy" means.
Alert fatigue and noise. Gartner estimates 70–90% of monitoring alerts are noise without proper correlation. Your engineer is spending half their verification time filtering out garbage signals. Every deploy becomes a scavenger hunt.
Flaky test paralysis. When a significant chunk of your test failures are flaky, teams develop a dangerous habit: they start ignoring test failures entirely. "Oh, that one always fails" becomes the default response. Then a real failure slips through because it looked like another flaky test.
Delayed rollbacks. When a human has to notice a problem, confirm it's real, gather context, and then make a decision, you're looking at 15–45 minutes of degraded service before anyone acts. Automated systems can detect and roll back in under 2 minutes.
Opportunity cost. This is the big one. Every hour an engineer spends staring at Grafana is an hour they're not building features, fixing tech debt, or improving the systems they're monitoring. For a team of 10 engineers deploying daily, you're looking at 150–300+ engineering hours per year burned on deployment babysitting.
At an average fully-loaded cost of $150–200/hour for a senior engineer, that's $22,500 to $60,000 per year. Per team. Just for the staring-at-dashboards part.
What AI Can Actually Handle Right Now
Here's where I get specific, because the AI hype in DevOps is real and most of it is vague hand-waving. Let me be concrete about what an AI agent built on OpenClaw can do today, reliably.
Anomaly detection with context. An OpenClaw agent can pull metrics from your observability stack (Datadog, Prometheus, New Relic—whatever you use), establish dynamic baselines from historical data, and flag statistically significant deviations. Not just "this number went up" but "this number went up in a way that's outside the normal variance window for this service at this time of day on this day of the week." That's the kind of nuance that eliminates 80% of false positives.
Log correlation and summarization. Instead of an engineer grepping through thousands of log lines, the agent ingests recent logs, filters out known/expected errors, identifies net-new error patterns that appeared after the deploy, and produces a human-readable summary: "3 new exception types detected post-deploy. NullPointerException in PaymentService.processRefund() appearing at 12 req/min. Not present in previous version."
Flaky test triage. This is a massive time-saver. The agent analyzes test results against historical pass/fail patterns. Tests that have failed intermittently over the last N runs get flagged as likely flaky. Tests that have been consistently passing and just started failing get flagged as likely real failures. You go from "47 failures, how many are real?" to "2 failures are likely real, here's why."
Statistical canary analysis. Instead of eyeballing two dashboards, the agent runs proper statistical comparisons (Mann-Whitney U tests, Kolmogorov-Smirnov tests, or whatever you configure) between your canary and baseline populations. It produces a confidence score: "Canary is 94% likely to be performing equivalently to baseline on error rate, latency, and throughput." That's an actual number, not a feeling.
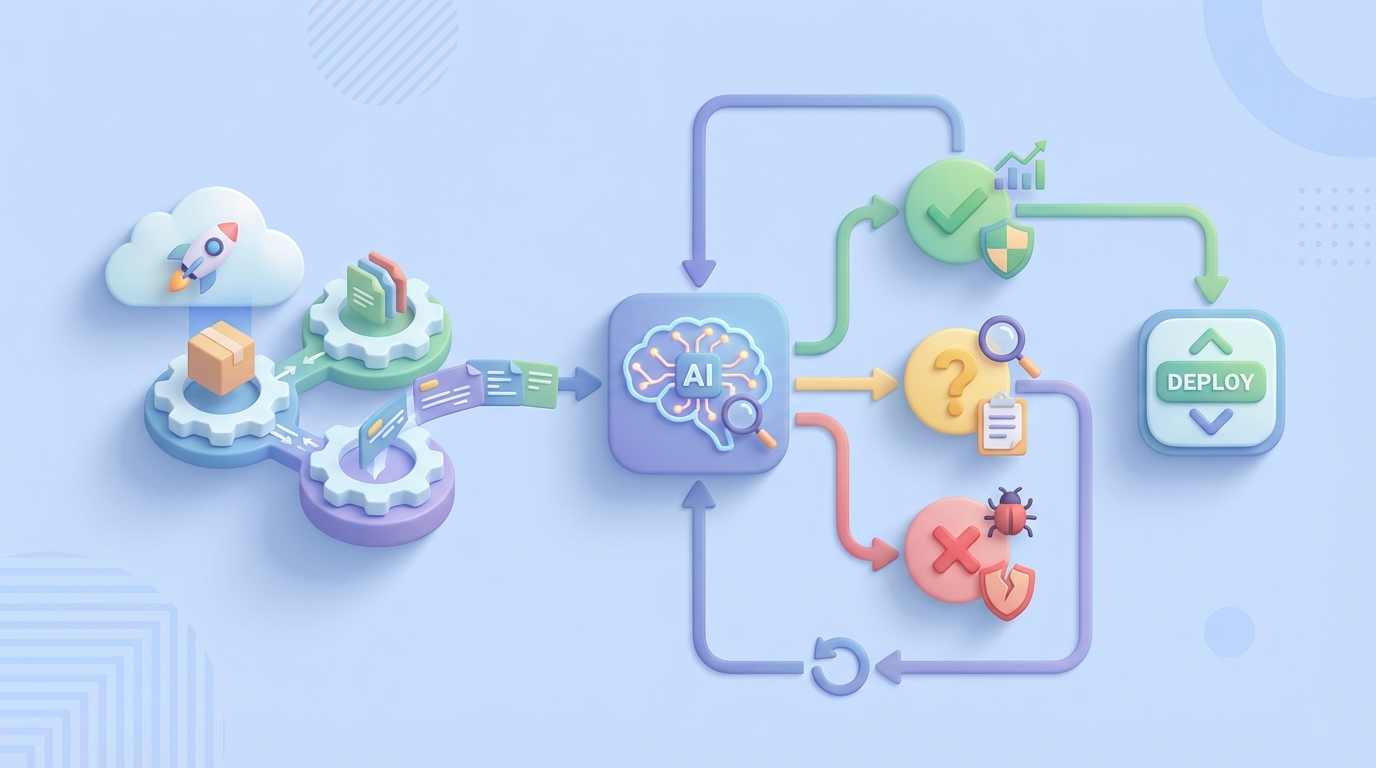
Automated go/no-go with confidence scoring. The agent synthesizes all of the above into a deployment health score with explanations. Above your threshold? Auto-promote. Below it? Auto-rollback. In the gray zone? Page a human with a detailed briefing so they can make a fast, informed decision instead of starting from scratch.
Step by Step: Building This with OpenClaw
Here's the practical implementation path. I'm going to assume you have a Kubernetes-based deployment pipeline and some flavor of observability tooling already in place.
Step 1: Define Your Verification Criteria
Before you build anything, codify what "healthy deployment" means for your services. Write it down. Be specific.
# verification-criteria.yaml
service: payment-api
metrics:
  error_rate:
    source: datadog
    query: "sum:http.errors{service:payment-api}.as_rate()"
    baseline_window: 7d
    max_deviation_percent: 15
    comparison: canary_vs_baseline
  p99_latency_ms:
    source: datadog
    query: "p99:http.request.duration{service:payment-api}"
    baseline_window: 7d
    max_deviation_percent: 20
  throughput:
    source: datadog
    query: "sum:http.requests{service:payment-api}.as_rate()"
    baseline_window: 7d
    min_deviation_percent: -25  # alert if traffic drops significantly
tests:
  smoke_suite: "ci/smoke-tests"
  flaky_threshold: 3  # failures in last 10 runs = likely flaky
logs:
  source: elasticsearch
  index: "payment-api-*"
  known_errors_file: "known-errors.json"
  new_error_threshold: 5  # unique new errors before flagging
rollback:
  auto_rollback_below_score: 60
  auto_promote_above_score: 85
  human_review_range: [60, 85]
This is the contract between your team and the AI agent. It removes the ambiguity that makes manual verification inconsistent.
Step 2: Build the Verification Agent on OpenClaw
In OpenClaw, you're building an agent that orchestrates the verification workflow. Here's the structure:
# deployment_verifier.py
# OpenClaw agent for post-deployment verification

import openclaw
from openclaw import Agent, Tool, Trigger

agent = Agent(
    name="deployment-verifier",
    description="Automated post-deployment verification agent",
    model="openclaw-reasoning-v2",
)

# Define the tools the agent can use
@agent.tool
def query_metrics(source: str, query: str, window: str) -> dict:
    """Pull metrics from observability platform."""
    # Connects to Datadog, Prometheus, New Relic, etc.
    # Returns time-series data for analysis
    ...

@agent.tool
def analyze_test_results(suite: str, run_id: str) -> dict:
    """Fetch test results and compare against historical flakiness."""
    # Pulls test results from CI system
    # Cross-references with flaky test database
    # Returns: real_failures, likely_flaky, total_passed, total_failed
    ...

@agent.tool
def search_logs(source: str, index: str, time_range: str,
                known_errors_file: str) -> dict:
    """Search logs for new error patterns post-deployment."""
    # Queries log store for errors in post-deploy window
    # Filters out known errors
    # Clusters and summarizes new errors
    ...

@agent.tool
def run_canary_analysis(metrics: list, canary_tag: str,
                        baseline_tag: str) -> dict:
    """Statistical comparison of canary vs baseline populations."""
    # Runs Mann-Whitney U test on each metric
    # Returns confidence scores per metric and aggregate
    ...

@agent.tool
def trigger_rollback(service: str, previous_version: str) -> dict:
    """Trigger automated rollback via ArgoCD/Helm."""
    ...

@agent.tool
def promote_canary(service: str) -> dict:
    """Promote canary to full production traffic."""
    ...

@agent.tool
def notify_team(channel: str, message: str, severity: str) -> dict:
    """Send notification to Slack/PagerDuty with verification report."""
    ...
Step 3: Wire Up the Verification Flow
The agent needs a trigger and a decision flow:
@agent.trigger(on="webhook", path="/verify-deployment")
async def verify_deployment(payload: dict):
    """
    Triggered by CI/CD pipeline after deployment completes.
    Payload includes: service, version, environment, canary_tag
    """
    service = payload["service"]
    config = load_verification_criteria(service)

    # Step 1: Wait for deployment to stabilize
    await agent.wait(minutes=config.get("stabilization_window", 5))

    # Step 2: Run all verification checks in parallel
    results = await agent.run_parallel([
        analyze_test_results(
            suite=config["tests"]["smoke_suite"],
            run_id=payload["ci_run_id"]
        ),
        query_and_analyze_metrics(config["metrics"]),
        search_logs(
            source=config["logs"]["source"],
            index=config["logs"]["index"],
            time_range="last_15m",
            known_errors_file=config["logs"]["known_errors_file"]
        ),
        run_canary_analysis(
            metrics=config["metrics"],
            canary_tag=payload.get("canary_tag"),
            baseline_tag=payload.get("baseline_tag")
        ),
    ])

    # Step 3: Synthesize results into deployment health score
    health_score = agent.reason(
        prompt="""Analyze these deployment verification results and
        produce a health score from 0-100 with detailed reasoning.
        Consider: test results, metric deviations, new errors,
        canary analysis confidence.""",
        context=results
    )

    # Step 4: Act on the score
    score = health_score["score"]

    if score >= config["rollback"]["auto_promote_above_score"]:
        await promote_canary(service)
        await notify_team(
            channel="#deploys",
            message=f"✅ {service} v{payload['version']} auto-promoted. "
                    f"Score: {score}/100\n{health_score['summary']}",
            severity="info"
        )
    elif score <= config["rollback"]["auto_rollback_below_score"]:
        await trigger_rollback(service, payload["previous_version"])
        await notify_team(
            channel="#deploys",
            message=f"🔴 {service} v{payload['version']} auto-rolled back. "
                    f"Score: {score}/100\n{health_score['summary']}",
            severity="critical"
        )
    else:
        await notify_team(
            channel="#deploys",
            message=f"🟡 {service} v{payload['version']} needs human review. "
                    f"Score: {score}/100\n{health_score['summary']}",
            severity="warning"
        )
Step 4: Connect to Your Pipeline
Add a webhook call to your existing CI/CD pipeline. In GitHub Actions, that's a simple addition:
# .github/workflows/deploy.yml
  - name: Trigger Verification Agent
    if: steps.deploy.outcome == 'success'
    run: |
      curl -X POST https://your-openclaw-instance.com/verify-deployment \
        -H "Authorization: Bearer ${{ secrets.OPENCLAW_API_KEY }}" \
        -H "Content-Type: application/json" \
        -d '{
          "service": "payment-api",
          "version": "${{ github.sha }}",
          "environment": "production",
          "ci_run_id": "${{ github.run_id }}",
          "canary_tag": "canary",
          "baseline_tag": "stable",
          "previous_version": "${{ env.PREVIOUS_SHA }}"
        }'
Step 5: Build the Known Errors Database
This is the part most people skip, and it's what makes the difference between a noisy agent and a useful one. Maintain a living document of known, accepted errors:
{
  "known_errors": [
    {
      "pattern": "ConnectionPool timeout to legacy-auth-service",
      "status": "accepted",
      "jira": "INFRA-2341",
      "notes": "Known issue, retry handles it, fix planned Q2"
    },
    {
      "pattern": "Redis READONLY error during failover",
      "status": "transient",
      "notes": "Normal during Redis cluster maintenance windows"
    }
  ]
}
The OpenClaw agent uses this to distinguish "new and scary" from "old and tolerated." Without it, every deploy looks broken.
Step 6: Iterate and Tune
Start with conservative thresholds. Set the auto-promote score high (90+) and the auto-rollback score low (50-). Let the agent run in advisory mode for the first two weeks—it generates the report and the score, but a human still makes the final call.
Track how often the human's decision matches the agent's recommendation. In my experience, after a couple of weeks of tuning, the agreement rate hits 90%+ for standard deploys. That's when you flip the switch to autonomous mode for routine deployments.
What Still Needs a Human
I'm not going to pretend AI handles everything. Here's what you keep humans on the hook for:
Business impact judgment. The agent can tell you conversion rate dropped 8%. It cannot tell you whether that's acceptable for this particular feature launch because your PM decided the new checkout flow might temporarily confuse users. That's a product decision, not a technical one.
Novel failure modes. If your system fails in a way it's never failed before—a new dependency starts returning corrupted data, a race condition that only manifests under a specific traffic pattern—the agent doesn't have training data for that. It'll flag the anomaly, but a human needs to diagnose the root cause.
Compliance and regulatory sign-off. If you're in finance, healthcare, or government, you likely have regulatory requirements for human approval on certain changes. The agent can prepare the briefing and do 95% of the verification work, but a human still signs.
Risk acceptance for high-stakes deploys. Database migrations, payment system changes, authentication overhauls—these deserve a human making the final call. Use the agent to inform the decision, not make it.
Architecture decisions when things go wrong. When verification fails, someone needs to decide: do we fix forward, roll back, or redesign? That's engineering judgment the AI assists but doesn't replace.
The key mindset shift is: humans should be making decisions, not observations. The agent handles all the observation and synthesis work. The human shows up with a clear briefing and makes a judgment call in 2 minutes instead of spending 45 minutes building the picture from scratch.
Expected Time and Cost Savings
Based on what I've seen from teams implementing this pattern, and supported by industry data from Harness, Dynatrace, and DORA reports:
| Metric | Before | After | Improvement |
|---|---|---|---|
| Human time per deployment | 30–120 min | 2–5 min (review report) | 85–95% reduction |
| Mean time to rollback | 15–45 min | 1–3 min (automated) | 90%+ reduction |
| False positive rate on alerts | 70–90% | 15–25% | ~70% reduction |
| Flaky test triage time | 15–30 min | 0 (automated) | 100% reduction |
| Deployment frequency (unlock) | 1–2/day (bottleneck) | 5–10+/day | 3–5x increase possible |
| Annual cost per team (10 engineers) | $22K–60K in eng time | $3K–8K (agent + review time) | 60–85% reduction |
The ROI is not subtle. For a 10-person team deploying daily, you're looking at recovering 150–300 engineering hours per year. That's almost a full quarter of an engineer's time, redirected from babysitting dashboards to building product.
The time-to-rollback improvement alone justifies the investment. If a bad deploy costs you $1,000/minute in revenue impact (common for e-commerce and SaaS), cutting rollback time from 30 minutes to 2 minutes saves you $28,000 per incident. Even one incident per quarter makes this pay for itself.
Where to Start
Don't try to automate everything at once. Here's the progression I recommend:
- Week 1–2: Codify your verification criteria in YAML. Just the act of writing down "what does healthy look like" for each service is valuable even without automation.
- Week 2–3: Build the OpenClaw agent in advisory mode. It runs the checks and posts a report to Slack. Humans still make all decisions.
- Week 4–6: Tune thresholds based on agreement between agent recommendations and human decisions. Add your known errors database.
- Week 6–8: Enable auto-promote for routine deploys on low-risk services. Keep human review for high-risk changes.
- Ongoing: Expand to more services. Tighten thresholds. Add more sophisticated analysis (business metrics, dependency health, etc.).
If you want to get started, head over to Claw Mart and grab pre-built deployment verification components from the marketplace. There are ready-to-use OpenClaw tools for Datadog integration, Kubernetes rollback management, log analysis, and canary scoring that'll save you from building everything from scratch.
Or if you've already got a verification workflow that's working and you think other teams could benefit from it—list it on Claw Mart through Clawsourcing. The best automation tools come from people who've actually solved these problems in production, and there's a growing community of DevOps practitioners sharing and selling their OpenClaw agents. Build once, sell repeatedly.
The deployment verification problem isn't technically hard. It's tedious, inconsistent, and expensive when done manually. AI agents are good at exactly this kind of work: structured data analysis, pattern comparison, statistical evaluation, and clear recommendation synthesis. Stop paying senior engineers to stare at dashboards. Let them build things instead.