Automate Daily Sales Reporting: Build an AI Agent That Summarizes POS Data
Automate Daily Sales Reporting: Build an AI Agent That Summarizes POS Data
Every restaurant manager I've ever talked to has the same evening ritual: close out the POS, run a stack of reports, open a spreadsheet, and start copying numbers. Then they reconcile cash. Then they chase down why there were seven voids on register two. Then they email a summary to the owner who glances at it over coffee the next morning, forty-eight hours after the data was actually useful.
This is insane. Not because the work is unimportant—it's critical—but because 80% of it is mechanical. Pull data from system A, compare it to system B, flag anything weird, format it into something readable, send it. That's exactly the kind of workflow an AI agent can handle while you go home and eat dinner with your family.
Let's break down how to actually build this with OpenClaw.
The Manual Workflow Today: What You're Really Doing Every Night
Here's what daily sales reporting actually looks like in most independent restaurants and small groups. I'm going to be specific because the details matter when you're figuring out what to automate.
Step 1: End-of-day close (10–15 minutes) Manager runs the day's reports from the POS—total sales, sales by category, payment method breakdown, then the exception reports: voids, comps, discounts, refunds, no-sales. Most POS systems make this pretty easy, but you're still clicking through multiple report screens and either printing or exporting each one.
Step 2: Cash and payment reconciliation (15–30 minutes) Count the physical cash in every drawer. Compare it against what the POS says should be there. Investigate any over/short amounts. Check that credit card batches actually settled with your merchant processor. If you run delivery through DoorDash, Uber Eats, or Grubhub, you're also checking those payouts against what your POS recorded.
Step 3: Data entry and transfer (15–25 minutes) Export CSVs or manually key numbers into your accounting software—usually QuickBooks. Update whatever master spreadsheet your owner or corporate office uses for tracking. If you're running multiple locations, multiply this by each one.
Step 4: Exception investigation (10–20 minutes) Go through every void and comp over a certain threshold. Was that $85 comp a legitimate mistake or something you need to talk to a server about? Categorize promotional discounts separately from error corrections. This is where most managers get bogged down, because each exception requires pulling up context—who ran the transaction, when, what was the original order.
Step 5: Report compilation and distribution (10–15 minutes) Format everything into whatever daily summary your ownership expects. Usually it's a mix of total revenue, covers, average check, comps as a percentage, labor cost for the day, and any notable callouts. Email it out. Wait for the inevitable follow-up questions.
Total: 60–105 minutes per location, per day. That's 8–12 hours per week, conservatively. The National Restaurant Association and Toast's 2026 data both peg the range at 8–20 hours weekly for administrative reporting, depending on complexity. Monthly close is a whole separate nightmare that can eat 2–4 full days.
Why This Hurts More Than You Think
The obvious cost is time. A manager making $55K–$65K per year who spends 12 hours a week on reporting is burning roughly $20,000 in annual labor on data entry and reconciliation. For a three-unit group, that's $60K.
But the hidden costs are worse.
Delayed insights. Most operators don't know their true daily profitability until 48–72 hours after close. By then, you've already repeated whatever mistake cost you money on Tuesday. Maybe your food cost spiked because a prep cook over-portioned the salmon special, but you didn't catch it until Thursday's review. That's two more days of bleeding margin.
Error rates. POS audits and Restaurant365 benchmarks consistently show that 1.5–4% of sales data contains errors or needs correction. When you're manually transferring data between systems—the dreaded "swivel chair" work—every copy-paste is a chance to introduce more errors.
Manager burnout and turnover. Restaurant manager turnover runs 30–40% annually. Nobody quits because they love doing spreadsheets. Every hour you free up for floor management, training, or just going home on time is an hour invested in retention.
Fragmentation tax. The average independent restaurant runs 3–5 disconnected systems: POS, payment processor, delivery platforms, accounting software, maybe an inventory tool. None of them talk to each other perfectly. You're the integration layer, and you're expensive and error-prone.
Only 23% of operators say they have "excellent" visibility into real-time performance, per the National Restaurant Association's 2026 data. The rest are flying partially blind, making decisions based on gut feel and stale numbers.
What AI Can Actually Handle Right Now
I'm not going to tell you AI will run your restaurant. It won't. But there's a huge category of work that is purely mechanical—aggregating data, comparing numbers, spotting patterns, and generating formatted summaries—that an AI agent does faster and more reliably than any human.
Here's what falls cleanly into the "automate it" bucket:
- Data aggregation across your POS, payment processor, and delivery platforms into a single view
- Automatic reconciliation of credit card batches against POS totals, flagging discrepancies
- Anomaly detection—unusual void patterns, cash shortages above threshold, sudden category shifts
- Report generation—daily sales summaries, variance reports, draft P&L statements, formatted and delivered however you want them
- Theoretical vs. actual food cost calculations based on your sales mix and recipe costs
- Natural language querying—asking "How did happy hour perform this Tuesday versus last month?" and getting an actual answer
- Trend analysis and forecasting based on historical patterns
OpenClaw is built for exactly this kind of multi-step, data-heavy agent workflow. Instead of stitching together a dozen API calls and prompt chains by hand, you define what the agent needs to do, connect your data sources, and let it run.
Step by Step: Building Your Daily Sales Reporting Agent on OpenClaw
Here's the practical implementation. I'll walk through architecture first, then the specific build.
1. Map Your Data Sources
Before you touch OpenClaw, write down every system your daily report pulls from:
- POS system (Toast, Square, Clover, Lightspeed, etc.)—this is your primary source for sales, payment, and exception data
- Payment processor—for settlement verification
- Delivery platforms (DoorDash, Uber Eats, Grubhub)—for third-party order reconciliation
- Accounting software (QuickBooks, Xero)—where final numbers need to land
Most modern POS systems have APIs. Toast's API gives you orders, payments, cash management data, and more. Square's is similarly comprehensive. If your POS doesn't have an API, you can work with scheduled CSV exports as a fallback.
2. Set Up Your OpenClaw Agent
In OpenClaw, you're going to create an agent with a clear purpose: pull, reconcile, analyze, and report daily sales data automatically after close.
Your agent definition should include:
- Data retrieval tools that connect to each source system's API
- A reconciliation workflow that compares POS totals against processor settlements and flags discrepancies above your defined threshold
- Exception analysis logic that categorizes voids, comps, and discounts, flagging anything that looks unusual based on historical patterns
- A report generation step that formats everything into your standard daily summary
- A delivery mechanism—email, Slack, SMS, or wherever your team consumes reports
Here's a simplified example of what defining the agent's core reconciliation task looks like in OpenClaw:
agent: daily_sales_reconciler
description: >
  Pulls end-of-day sales data from POS and payment processor,
  reconciles totals, flags exceptions, generates daily summary report.

tools:
  - name: pos_api_connector
    source: toast_api
    actions: [get_daily_sales, get_payments, get_voids_comps]

  - name: processor_connector
    source: merchant_processor_api
    actions: [get_settlement_report]

  - name: delivery_platform_connector
    source: [doordash_api, ubereats_api]
    actions: [get_daily_orders, get_payout_summary]

  - name: accounting_push
    source: quickbooks_api
    actions: [create_journal_entry, update_sales_category]

workflow:
  - step: pull_all_sources
    description: Retrieve daily data from all connected systems
    trigger: daily_at_close  # or scheduled time, e.g., 11:30 PM

  - step: reconcile_payments
    description: >
      Compare POS payment totals against processor settlement.
      Flag any discrepancy > $10 or > 0.5% of daily total.

  - step: analyze_exceptions
    description: >
      Review all voids, comps, discounts. Compare against
      trailing 30-day averages. Flag items exceeding 1.5x
      historical norms or individual items > $75.

  - step: calculate_metrics
    description: >
      Compute total revenue, covers, avg check, comp %,
      discount %, sales by category, payment method split,
      comparison to same day last week and trailing 4-week avg.

  - step: generate_report
    format: structured_summary
    delivery: [email, slack_channel]

  - step: push_to_accounting
    description: Create daily journal entry in QuickBooks
    requires_approval: true  # human approves before posting
This isn't pseudocode for show—this is the kind of structured agent definition OpenClaw is designed to handle. You define the tools, the workflow, and the decision logic, and the platform orchestrates execution.
3. Define Your Thresholds and Business Rules
This is where your specific restaurant knowledge becomes configuration. You're encoding the stuff that currently lives in your manager's head:
- Cash variance threshold: Flag anything over/short by more than $15
- Void threshold: Flag individual voids over $50, or total void percentage exceeding 3% of daily sales
- Comp categorization: Separate employee meals, manager comps, quality issues, and promotional comps
- Delivery reconciliation tolerance: Allow up to 2% variance between POS and platform payouts (commissions and fees create legitimate differences)
- Comparison baselines: Same day last week, trailing 4-week average for that day of week, and year-over-year if you have the data
4. Build the Report Template
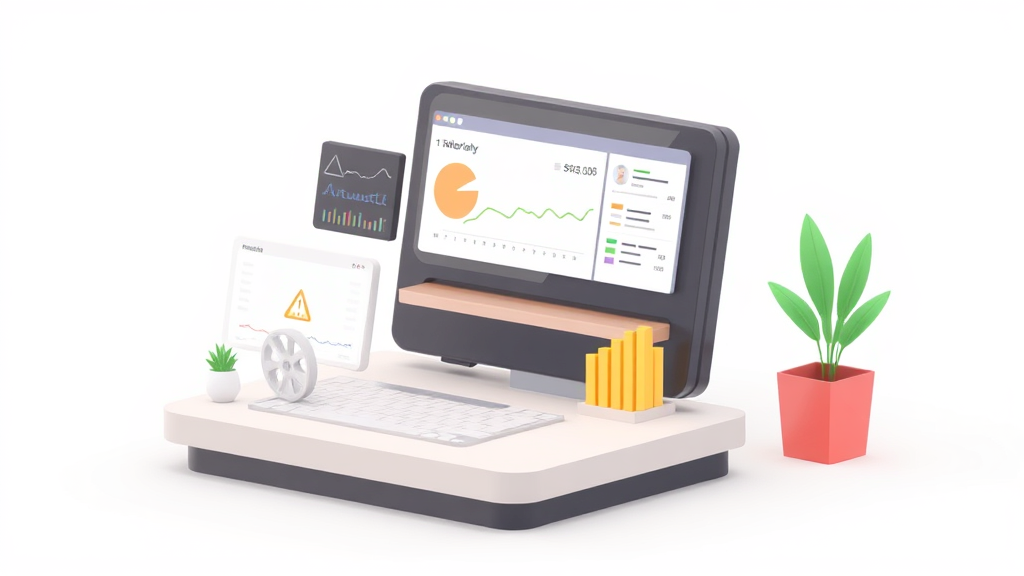
Your agent's output should match exactly what your team already expects. If your owner wants to see total revenue, food vs. beverage split, covers, average check, comp percentage, and a bullet-point list of anything unusual—that's what the agent generates.
An OpenClaw agent can produce a structured summary like this:
DAILY SALES REPORT — [Location Name]
Monday, Revenue: $8,247
vs Last Monday: +4.2% | vs 4-Week Avg: +1.8%

SALES BREAKDOWN
Food: $5,612 (68.1%) | Beverage: $2,141 (26.0%) | Other: $494 (5.9%)

COVERS & CHECK
Total Covers: 187 | Avg Check: $44.10 (+$1.20 vs 4wk avg)

PAYMENT MIX
Credit: $6,890 | Cash: $1,057 | Gift Card: $300
Cash variance: -$3.40 ✓ (within threshold)

EXCEPTIONS (2 flagged)
⚠ Void: $92 on check #4471 (Server: M. Torres, 7:42 PM) — above $50 threshold
⚠ Comp %: 5.1% vs 3.2% avg — driven by 3 comps totaling $418
   → Private event adjustment ($350) + quality issue ($68)

DELIVERY PLATFORMS
DoorDash: $1,240 (47 orders) | Uber Eats: $680 (22 orders)
Platform payout reconciliation: ✓ within tolerance

ACCOUNTING
→ Journal entry drafted in QuickBooks. Awaiting approval.
That report is generated automatically at 11:45 PM, sitting in the owner's inbox before midnight. No manager stayed late to build it.
5. Iterate and Refine
Your first version won't be perfect. That's fine. The beauty of building on OpenClaw is that you can adjust thresholds, add new data sources, or modify report formatting without rebuilding from scratch. Start with the core POS data and payment reconciliation. Once that's running clean for two weeks, add delivery platform reconciliation. Then layer in accounting integration.
What Still Needs a Human
Let's be honest about the limits. AI doesn't understand context the way your manager does.
You still need humans for:
- Business context interpretation — "Sales were down Tuesday because we closed early for a gas leak." The agent flags the anomaly. The human explains it.
- Approving large comps and investigating potential fraud — The agent can flag that a server has 3x the average void rate. A human decides whether it's a training issue or a theft issue.
- Final sign-off on financial entries — Notice that
requires_approval: trueflag in the accounting step. Don't auto-post journal entries without review, at least not until you've validated accuracy over several months. - Strategic decisions — The data tells you that your appetizer sales dropped 15% this month. The human decides whether to redesign the menu section, change pricing, or retrain servers on upselling.
- Tax and compliance — Your accountant should still review monthly financials. The agent gets them the clean data faster.
The best framework is simple: AI handles the 80% that's mechanical. Humans handle the 20% that requires judgment. The agent does the grunt work and surfaces the decisions. You make them.
Expected Time and Cost Savings
Based on what operators are reporting with similar automation setups (Toast's integrated analytics, Restaurant365's AI features, MarginEdge's automation), here's a realistic expectation for a typical independent or small group:
| Metric | Before | After |
|---|---|---|
| Daily reporting time | 60–105 min/day | 10–15 min/day (review only) |
| Weekly admin hours | 8–20 hours | 2–4 hours |
| Monthly close | 2–4 days | 0.5–1 day |
| Data error rate | 1.5–4% | Under 0.5% |
| Time to insight | 48–72 hours | Same night |
| Annual labor cost on reporting (per location) | ~$15,000–$22,000 | ~$3,000–$5,000 |
For a three-location group, that's roughly $30,000–$50,000 in annual savings, mostly recaptured as manager hours redirected to operations—the work that actually moves the needle on guest experience and revenue.
The less quantifiable benefit is speed. When you know tonight that your food cost spiked, you fix it tomorrow morning. That kind of responsiveness compounds over weeks and months into meaningful margin improvement. The industry average gap between theoretical and actual food cost is 2.8%—and much of that is attributable to slow reporting, not actual waste.
What To Do Next
If you're currently spending an hour or more every night on reporting—or worse, not doing it consistently because your managers are too busy—this is a high-ROI automation target. It's bounded, data-driven, and repetitive. Perfect for an AI agent.
Start by auditing your current workflow. Time each step for a week. Identify which systems have APIs and which require export workarounds. Then build your first agent on OpenClaw, starting with just the core POS data pull and report generation. You can have a working prototype in a day or two.
If you don't want to build it yourself, that's what Clawsourcing is for. Browse the Claw Mart marketplace for pre-built restaurant reporting agents, or post your specific workflow and let an OpenClaw developer build it for you. Either way, stop spending your evenings copying numbers between spreadsheets. The machines are better at it, and you have a restaurant to run.
Recommended for this post
Your orchestrator that coordinates agent swarms with task decomposition and consensus protocols -- agents working together.
Your Slack expert that builds bots, automates workflows, and integrates team notifications.
Your stealth ops specialist that handles quiet launches, manages shadow projects, and protects sensitive initiatives.