AI Agent for Upstash: Automate Serverless Redis and Kafka Management, Usage Alerts, and Rate Limiting
Automate Serverless Redis and Kafka Management, Usage Alerts, and Rate Limiting
Most teams using Upstash are doing the same thing: they set up serverless Redis, maybe QStash for background jobs, wire up some rate limiting, and then... manually check the dashboard every few days to see if anything's on fire. Maybe they set a budget alert in Upstash's console. Maybe they don't.
The problem isn't Upstash. Upstash is genuinely excellent infrastructure — serverless Redis that actually works, QStash for reliable message delivery, a solid vector database for AI workloads. The problem is what sits on top of it: usually nothing. Or a handful of brittle scripts that someone wrote six months ago and nobody wants to touch.
What if you had an AI agent that understood your entire Upstash setup — every Redis database, every QStash schedule, every rate limiting configuration — and could monitor it, optimize it, and take action autonomously?
That's what we're going to build with OpenClaw.
Why Upstash Needs an Intelligence Layer
Upstash gives you reliable execution. You define a workflow in code, deploy it, and it runs. QStash retries failed deliveries. Redis serves your cached data. It all works.
But "works" isn't the same as "works well" or "works efficiently" or "isn't slowly bleeding money."
Here are real problems I've seen teams run into with Upstash:
Cost creep from inefficient Redis patterns. Upstash charges per command. A developer writes a loop that issues 500 individual GET commands instead of a single MGET. Nobody notices until the bill doubles. This happens constantly.
Rate limiting that doesn't adapt. You set a rate limit of 100 requests per minute for your API. But your traffic patterns shift — maybe you get featured on Hacker News, maybe a customer's integration goes haywire. The static rate limit either blocks legitimate traffic or lets abuse through.
QStash schedules that nobody audits. You create a scheduled task for a feature. The feature gets deprecated. The scheduled task keeps running, consuming resources, maybe hitting endpoints that return errors. Nobody remembers it exists.
No correlation between services. Your Redis cache hit rate drops. Your QStash queue depth increases. Your vector database query latency spikes. These are related, but nothing connects the dots.
Upstash doesn't solve these problems because Upstash isn't trying to. It's infrastructure. The intelligence layer is supposed to be your job.
OpenClaw makes it so you can actually build that layer without hiring a platform engineering team.
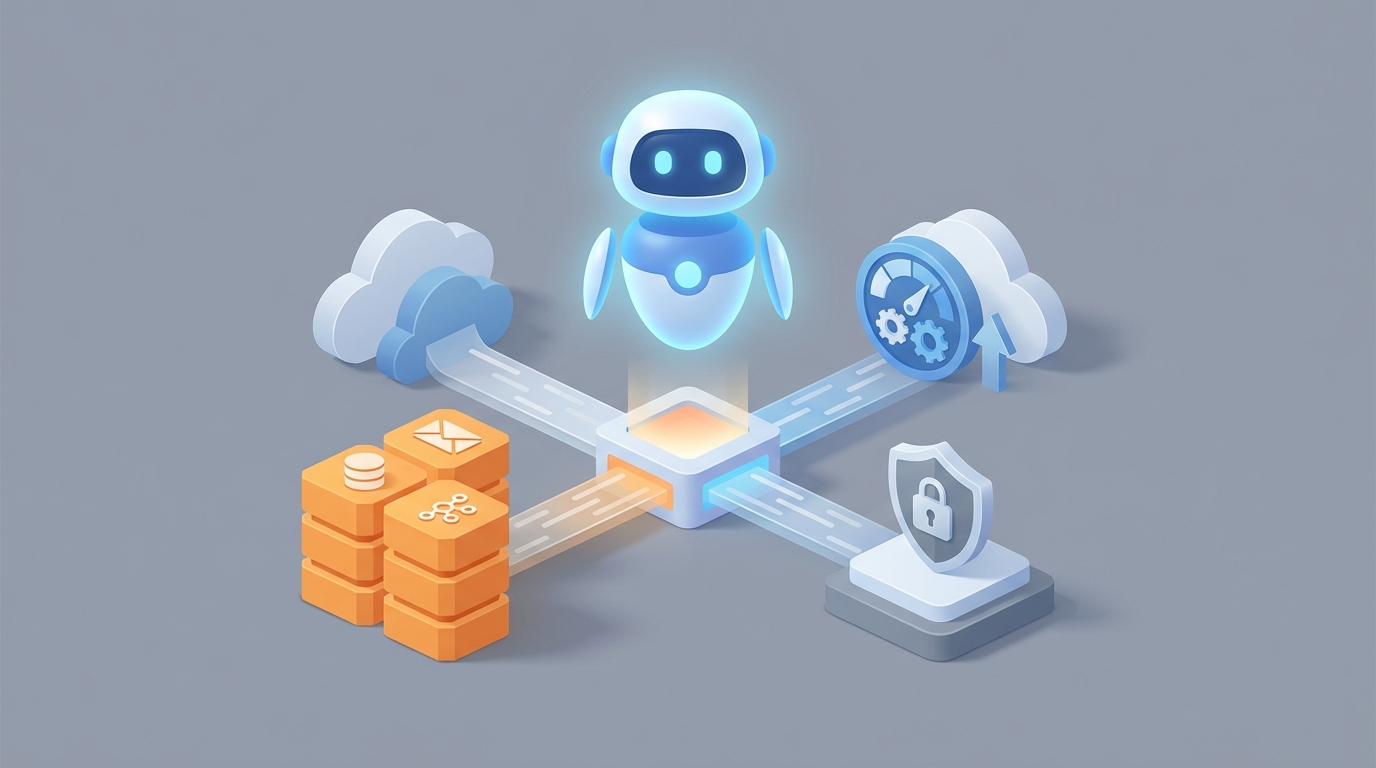
The Architecture: OpenClaw + Upstash API
Here's how this works at a high level. OpenClaw agents connect to Upstash through its HTTP APIs — which, to Upstash's credit, are excellent. Almost everything in Upstash is accessible via REST:
- Redis: Send any Redis command via
POSTwith a JSON array like["MGET", "key1", "key2"] - QStash: Publish messages, manage schedules, inspect dead-letter queues
- Vector: Upsert embeddings, query with metadata filters
- Kafka: Produce and consume via HTTP
The OpenClaw agent sits between your application logic and these APIs, adding a decision-making layer that can observe, reason, and act.
Your App → OpenClaw Agent → Upstash APIs (Redis, QStash, Vector, Kafka)
                ↕
        Monitoring & Action Loop
The agent isn't replacing Upstash. It's making Upstash smarter. Think of it as an SRE that never sleeps and actually reads the documentation.
Workflow 1: Automated Cost Optimization
This is the highest-ROI workflow for most teams. Upstash's per-command pricing means that how you use Redis matters as much as what you use it for.
What the OpenClaw Agent Does
- Polls Upstash usage data on a recurring schedule (daily or hourly, depending on your volume).
- Analyzes command patterns by inspecting Redis
INFOstats and command counts. - Identifies inefficiencies like:
- High volumes of individual
GET/SETcommands that could be batched withMGET/MSETor pipelines - Keys with very low TTLs being refreshed constantly (thrashing)
- Large numbers of
KEYSorSCANcommands in production (almost always a code smell) - Sorted sets being used where simpler structures would suffice
- High volumes of individual
- Generates specific recommendations with estimated cost savings.
- Optionally takes action — like adjusting TTLs on cache keys that are refreshing too aggressively.
Implementation Sketch
In OpenClaw, you'd configure the agent with access to Upstash's Redis HTTP endpoint and your management API credentials. The agent's tool configuration looks something like this:
tools:
  - name: upstash_redis_command
    type: http
    endpoint: "https://{{UPSTASH_REDIS_URL}}"
    method: POST
    headers:
      Authorization: "Bearer {{UPSTASH_REDIS_TOKEN}}"
    body_format: json_array

  - name: upstash_usage_stats
    type: http
    endpoint: "https://api.upstash.com/v2/redis/stats/{{DATABASE_ID}}"
    method: GET
    headers:
      Authorization: "Basic {{UPSTASH_MANAGEMENT_TOKEN}}"
The agent's instruction set includes rules like:
Monitor daily command volume. If GET commands exceed 70% of total commands
and MGET usage is below 5%, flag as potential batching opportunity.

Calculate estimated savings: (excess_individual_gets * cost_per_command)
vs (equivalent_mget_calls * cost_per_command).

If estimated monthly savings exceed $50, send alert to Slack.
If estimated monthly savings exceed $200, create a detailed report
with specific code-level recommendations.
This isn't magic. It's pattern matching that any experienced Redis user could do — if they had time to stare at usage dashboards all day. The OpenClaw agent does it automatically.
Workflow 2: Intelligent Rate Limiting
Upstash has a built-in rate limiting library, and it's fine for static limits. But static limits are a blunt instrument.
What the OpenClaw Agent Does
- Monitors rate limit hit rates across your API endpoints.
- Detects anomalies — sudden spikes from specific API keys, unusual geographic patterns, gradual increases that suggest organic growth.
- Adjusts rate limits dynamically based on context:
- If a trusted enterprise customer is hitting their limit during a legitimate data migration, temporarily increase their limit and notify your team.
- If an unknown API key starts hammering your endpoint at 10x normal volume, tighten the limit and flag for review.
- If overall traffic is growing steadily, proactively recommend limit adjustments before customers start complaining.
How It Works in Practice
The agent reads rate limit counters from Redis:
["GET", "ratelimit:api_key_abc123:current"]
["TTL", "ratelimit:api_key_abc123:current"]
It correlates this with historical data it maintains (stored back in Upstash Redis, naturally):
["ZADD", "ratelimit:history:api_key_abc123", "1718000000", "{"count": 847, "limit": 1000, "blocked": 12}"]
When the agent detects a pattern — say, an API key that's been hitting 90%+ of its limit for three consecutive days — it can:
- Query your customer database (via another tool) to understand the account context.
- Decide whether this is growth (good) or abuse (bad).
- Either adjust the limit in Redis directly or create a QStash message to trigger a review workflow.
["SET", "ratelimit:config:api_key_abc123:limit", "1500"]
The key insight: this is contextual rate limiting. The agent doesn't just count requests. It understands what the requests mean.
Workflow 3: QStash Schedule Hygiene
Every team I've worked with that uses scheduled tasks has zombie schedules — tasks that are still running but serving no purpose. QStash makes it easy to create schedules and easy to forget about them.
What the OpenClaw Agent Does
- Lists all active QStash schedules via the management API.
- Checks each schedule's destination endpoint — is it returning 200s? Is it returning errors? Is the endpoint even still deployed?
- Cross-references with your codebase (if you give it repo access) or deployment logs to identify orphaned schedules.
- Inspects the dead-letter queue for recurring failures.
- Reports findings and can automatically pause or delete confirmed zombie schedules.
tools:
  - name: qstash_list_schedules
    type: http
    endpoint: "https://qstash.upstash.io/v2/schedules"
    method: GET
    headers:
      Authorization: "Bearer {{QSTASH_TOKEN}}"

  - name: qstash_delete_schedule
    type: http
    endpoint: "https://qstash.upstash.io/v2/schedules/{{schedule_id}}"
    method: DELETE
    headers:
      Authorization: "Bearer {{QSTASH_TOKEN}}"

  - name: qstash_dlq
    type: http
    endpoint: "https://qstash.upstash.io/v2/dlq"
    method: GET
    headers:
      Authorization: "Bearer {{QSTASH_TOKEN}}"
The agent checks daily. When it finds a schedule whose endpoint has returned 5xx errors for the last 10 invocations, it sends you a report:
"Schedule
sched_abc123(runs hourly, targetsPOST /api/cleanup-temp-files) has failed 10 consecutive times with 502 errors. The endpoint was last deployed 47 days ago. This schedule has consumed approximately 720 QStash messages in the last 30 days. Recommend: delete or pause pending review."
That's specific, actionable, and would have taken a human 20 minutes of digging through dashboards to figure out.
Workflow 4: Cross-Service Anomaly Detection
This is where the AI agent really earns its keep. Individual Upstash services give you metrics for that service. Nobody connects the dots between them.
What the OpenClaw Agent Does
The agent maintains a holistic view of your Upstash infrastructure:
- Redis: Command volume, memory usage, cache hit/miss ratios, key expiration rates
- QStash: Queue depth, delivery success rates, DLQ size, schedule execution times
- Vector: Query latency, index size, upsert rates
- Kafka: Consumer lag, message throughput, partition distribution
It builds a baseline model of "normal" for your setup. When things deviate, it reasons about why:
Example scenario: Redis cache hit rate drops from 85% to 60% over two hours. Simultaneously, QStash queue depth increases by 3x. The agent connects these: a deployment likely changed caching behavior, causing more cache misses, which means more database queries, which means more background jobs being queued. It alerts you with the full chain of causation, not just "cache hit rate is low."
Another example: Vector database query latency doubles. The agent checks — the index grew by 40% in the last week due to a new feature that's upserting embeddings more aggressively than expected. It projects that at current growth rate, you'll hit the next pricing tier in 12 days, and recommends either optimizing the upsert frequency or pre-emptively adjusting your budget.
Workflow 5: Self-Healing Workflows
Upstash Workflow gives you durable execution with retries. But retries only help if the underlying problem is transient. If your workflow is failing because of a configuration issue or a downstream dependency change, retrying the same thing 5 times just wastes resources.
The OpenClaw agent monitors workflow execution and intervenes intelligently:
- Detects repeating failure patterns — same error, same step, across multiple workflow runs.
- Classifies the failure — transient (network blip), configuration (wrong endpoint), logical (data validation), or dependency (external service down).
- Takes appropriate action:
- Transient: let retries handle it, just monitor.
- Configuration: pause the workflow, alert the team with specific fix instructions.
- Dependency: check the external service status, pause workflows that depend on it, resume when it's back.
- Logical: flag for human review with the full execution context.
This turns Upstash Workflow from "retry and hope" into "retry with intelligence."
Setting This Up in OpenClaw
The practical steps:
-
Create your OpenClaw agent with the Upstash tool integrations described above. You'll need your Upstash REST URLs, tokens, and management API credentials.
-
Define your monitoring schedule — most workflows run well on hourly or daily checks. Cost optimization can be daily. Rate limit monitoring should be more frequent, maybe every 15 minutes.
-
Set action thresholds — decide what the agent can do autonomously (adjust TTLs, pause zombie schedules) vs. what requires human approval (delete data, change rate limits for enterprise customers).
-
Configure alert destinations — Slack, email, PagerDuty, whatever your team uses. The agent should escalate based on severity.
-
Start conservative — begin with monitoring and recommendations only. Once you trust the agent's judgment, gradually enable autonomous actions.
The entire setup in OpenClaw takes an afternoon, not a sprint. You're connecting HTTP APIs and writing natural language instructions, not building a monitoring platform from scratch.
What This Gets You
After running this for a month, a typical team sees:
- 10-30% reduction in Upstash costs from command optimization alone
- Zero zombie QStash schedules (they get caught within 24 hours)
- Faster incident response because the agent correlates signals across services before you even notice something's wrong
- Adaptive rate limiting that actually responds to real traffic patterns instead of arbitrary static numbers
- Less operational anxiety — someone (something) is actually watching your infrastructure
Upstash gives you excellent serverless infrastructure. OpenClaw gives you the operational intelligence to run it well. Together, they replace a surprising amount of what a dedicated platform engineering team would do.
Next Steps
If you want an OpenClaw agent built and configured for your specific Upstash setup — including the monitoring workflows, cost optimization rules, and alerting integrations described here — check out Clawsourcing. We'll scope it, build it, and hand you a working agent, not a proposal deck.